Few months ago, I was looking for a way to check the evolution of the structure of one SQLite database I am working on, so I thought having a simple way to get a schema of my database would be a simple solution. A colleague of mine suggested to give SchemaCrawler a try, and so I gave it a go.
I quickly realized that the easiest way to use it on my Debian machine was to use the Docker image, and so I did
| |
I kept following the guidelines to use it:
| |
Briefly, the options used do the following (see man docker run and/or https://docs.docker.com/engine/reference/run):
with
-v $(pwd):/home/schcrwlr/shareDocker creates a bind mount where the current directory ($(pwd)) is mounted in the Docker in the Docker container inhome/schcrwlr/share; note that the colon is used for the separation;--name schemacrawlernames the container;--rmautomatically cleans up the container;-itriggers the interactive mode;-tallocates a pseudo-TTY (teletypewriter), that allows to run an interactive shell;--entrypoint=/bin/bashspecifies that we run bash when the container starts.
Then inside te container I used the following lines
| |
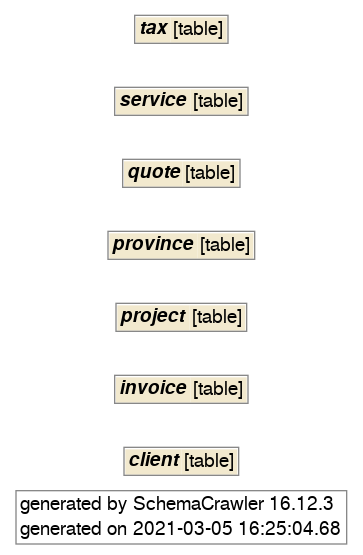
I think the option names are pretty clear here. The only thing I would like to stress is that to directly obtain the graphic from the container we need to save the figure to share where the current directory has been mounted as explain above. This command line yielded the following image for my SQLite
database:
As I think the level of details was not high enough, I used the maximum level of details by doing
| |
which return the following .png image
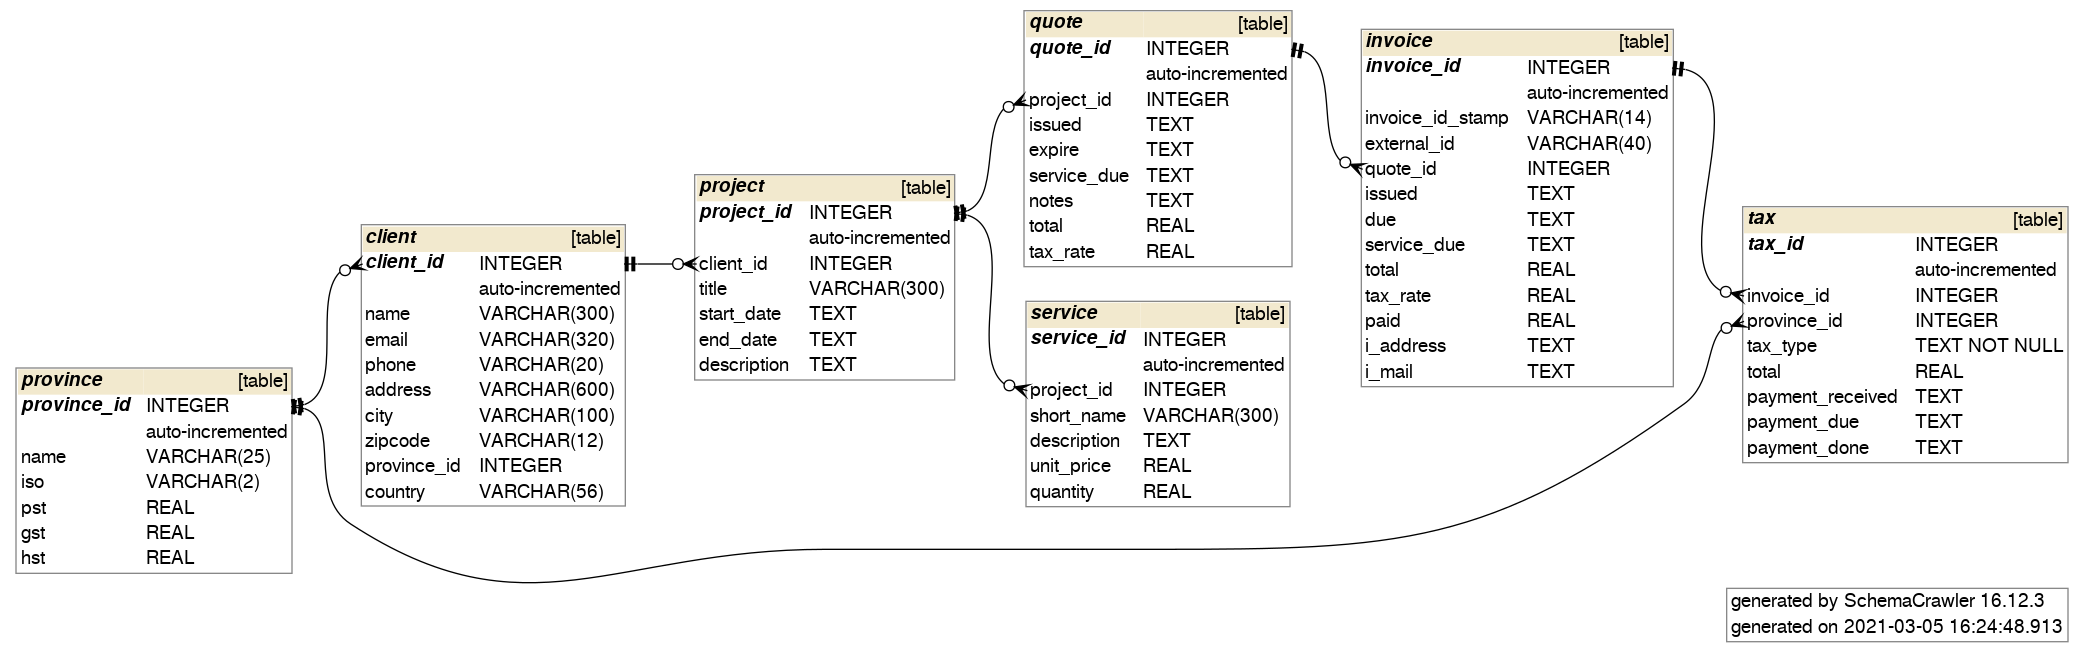
which is the kind of schema I actually needed! Pretty neat, isn’t it?